- Conduct Wildfire Simulations
- Optimize Weather Stations
- Weather Station Application
- Open Source Materials
- Pilot Upper-Air Profiler
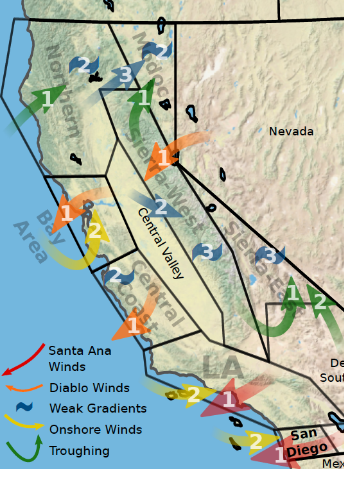
The historical analysis map shows the locations of California’s eight fire regions and the extreme weather types associated with each.

The arrows show the predominant low-level wind direction of each extreme weather type. The colors of the arrows indicate the dominant atmospheric process associated with the extreme weather type. The eight regions were defined based on fuel and fire weather conditions. No extreme weather types were derived for the Central Valley and the Desert Southwest because of their small sample size of observed fires. The Northern and Sierra regions are mainly forested. The central and southern coastal regions feature chaparral, grass-oak savanna, and urban areas. Fire ignition is mostly human-caused in urban regions, caused by dry lightning in the Northern and Modoc regions, and of mixed natural and human cause in the Sierra regions.
We analyzed the types of extreme weather associated with major fires in eight distinct regions across California.