- Conduct Wildfire Simulations
- Optimize Weather Stations
- Weather Station Application
- Open Source Materials
- Pilot Upper-Air Profiler
California experiences its largest and most destructive fires during periods of strong offshore winds, which are known as Diablo winds in Northern California and Santa Ana winds in Southern California.
These winds occur as high pressure forces air over the Sierra Nevada Mountains and toward the Pacific Ocean. The winds accelerate through canyons, producing strong gusts, drying out vegetation, and sometimes driving fast-spreading wildfires.
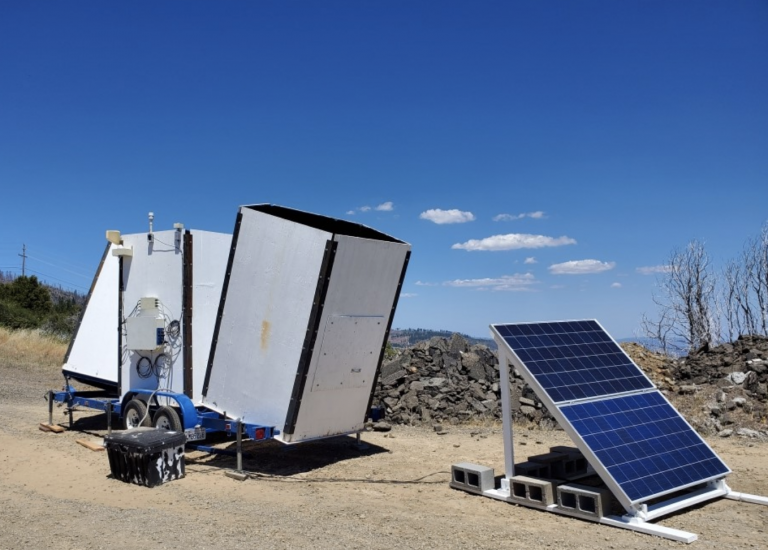
To protect Californians from wildfire, the Pyregence Extreme Weather Team is working to improve forecasts of these wind events. The team conducted a pilot test deployment of an upper-air wind profiler called a sodar to measure winds 80–600 meters above ground level.
The results indicate that upper-air wind data could improve short-term wind and fire weather forecasts. During a Diablo event at the test site, strong winds were detected in the upper air approximately 8–10 hours before they appeared at the surface.
“We were able to show that a well-located sodar is able to predict the onset of strong wind gusts at the surface on a time scale of several hours,” says Kenneth Craig, a Senior Atmospheric Scientist and Meteorologist with Sonoma Technology, an environmental consulting firm that conducted the study for Pyregence.
Several hours of advance warning could be critical in helping electric utilities and government officials protect life and property by ordering public safety power shutoffs, deploying firefighting crews, and planning evacuation routes.
The team recommends installing a network of strategically placed upper-air wind profilers throughout California to help inform ground-based meteorological networks and improve fire weather forecasts.
“The ability to predict when winds aloft are going to hit the surface is really important from a fire management perspective,” says Tami L. Lavezzo, Vice President and Senior Scientist with Sonoma Technology. “That situational awareness helps determine where to deploy resources to better manage and fight the fire.”
A consortium of leading researchers from 18 institutions representing industry, academia, and government, Pyregence is building next-generation tools to address the rising threat of wildfires.
To support that goal, the Extreme Weather Team is working to improve the collection of weather data to better understand and predict the conditions that encourage wildfires to spread.
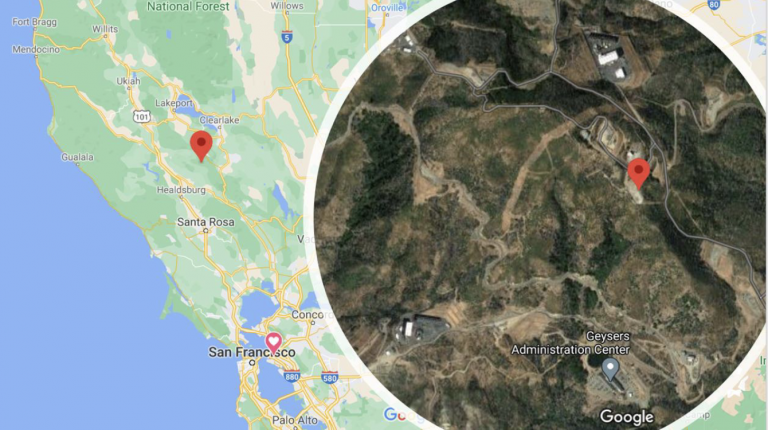
For the test deployment of the upper-air profiler, the team chose a ridgetop location in Northern California about two miles from Cobb Mountain.
The site, with an elevation of 3,720 feet, experiences easterly offshore winds as they flow over the Sierra Nevadas and down through valleys toward the San Francisco Bay Area.
Another advantage of the chosen site is that it is remote, far away from people who might be bothered by the loud noises produced by sodar.
Sodar is similar to radar except that it relies not on radio frequencies but on acoustic signals. At 91 decibels, these signals are “a very loud, pulsing beep,” according to Bryan Penfold, Manager of the Data Analysis group at Sonoma Technology. If you’re trying to work or sleep, you wouldn’t want a sodar next door.
The device—the test deployment used an Atmospheric Systems Corporation Model 2000—sends up pulses of sound, which are scattered by atmospheric turbulence. A receiver measures the transmitted sound that is scattered back toward the sodar. These back-scattered signals are received at a slightly different frequency than the transmitted signals, and the difference is used to calculate the speed, direction, and height of winds.
Profilers offer distinct advantages over other data collection methods. Most upper-atmosphere weather data is collected using radiosondes, instruments carried aloft, generally by balloon, two times a day. Profilers, by contrast, gather data two or three times every hour, and they also collect more detailed information throughout the lowest levels of the atmosphere—factors that allow for more accurate forecasts.
In 2003, for example, a profiler in New Mexico detected intensifying upper-air winds that had been missed by nearby radiosonde observations. The profiler helped forecasters accurately predict a midnight wind surge, giving fire crews the information they needed to rapidly contain the spread of the fire.
“Sodars have the ability to provide information that you can’t get from other instruments, and that are not available in the surface meteorological network,” Craig says.
For the Pyregence pilot test, the sodar system collected data from July 25 through October 26, 2020.
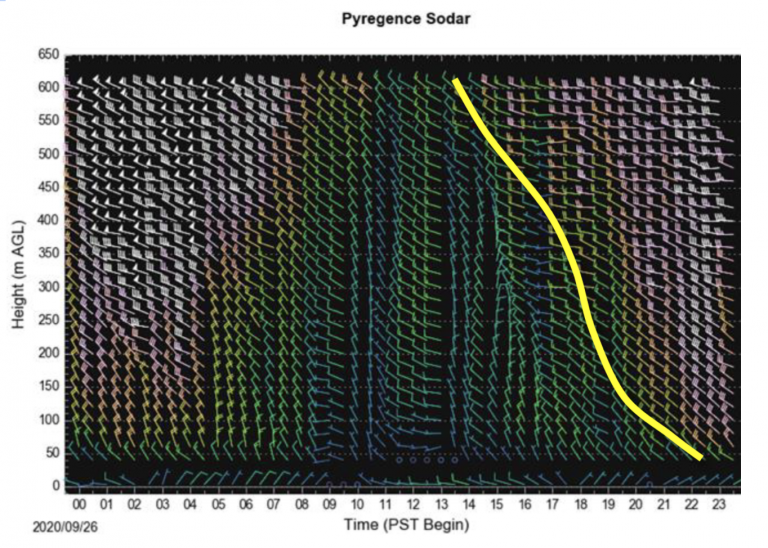
Although a number of high-wind events occurred at the site during the pilot study period, a Diablo event that developed in late September proved particularly revealing.
Between 3 and 4 p.m. on September 25, strong winds developed 300–600 meters above ground level. Then, just after 1 a.m. that night, surface wind gusts of about 35 mph were recorded. The next day saw a similar pattern: strong winds developed aloft in the midafternoon and then gradually descended to the surface around midnight.
Both days, that is, saw high winds develop first in the upper atmosphere and then, about 8–10 hours later, descend to the surface. That time gap offers a window of opportunity to improve wildfire preparedness, especially during active fire situations.
The ridgetop site for the deployment also proved critical. Two other sodars at lower elevations closer to San Francisco Bay detected the late September event but did not capture the distinctive pattern of strong winds descending from the upper air to the surface. In other words, the data differed dramatically at higher and lower elevations within the same region, highlighting the need for a robust monitoring network with observing stations at carefully chosen locations.
“Even with an instrument that only provides a few hundred meters of vertical range, we could still see very clear evidence of these winds descending toward the surface,” Craig says. “That has powerful implications in terms of planning future instrumentation.”
The Extreme Weather Team concluded that a statewide network of strategically placed upper-air profilers could improve short-term forecasts of surface winds and help scientists who model fire behavior better understand the complex interactions of the atmosphere and wildfire.
With advance warning of when strong surface winds will appear, electric utilities can make more informed decisions about power shutoffs, emergency management officials can decide when evacuations are necessary, and firefighting agencies can position crews and equipment where they are needed most.
How many sodars are needed? Although the scientists who led the study cautioned that they had not conducted a detailed analysis of this issue, they indicated that a relatively small number—perhaps in the range of 10–15 sodars carefully positioned across California—could dramatically improve the ability to predict strong winds.
“You don’t have to blanket every geographic area with instruments—there’s always a balance between the cost and the benefit,” Craig says. “But a handful of strategically placed sodars would fill gaps in our observing network and provide valuable information to support situational awareness and forecasting efforts.”
The upper-air wind profiler test is just one aspect of the Pyregence Extreme Weather Team’s research into the weather conditions associated with large wildfires.
Other scientists on the team have identified a set of “extreme weather types” linked to large wildfires across eight regions in California, and are also using microscale weather modeling to locate areas where atmospheric wind, temperatures, and terrain combine to produce extreme winds. For more on this research, read this blog post.
Other team members are identifying “blindspots” in the network of surface weather stations maintained by electric utilities, in order to help them site new weather stations in areas where they are critically needed. Stay tuned for results of this research, expected this fall.